Your PPC Monthly Report Template
Looking to create a monthly report to measure the success of your PPC campaigns? Smart! Frequent reporting will help guide your campaign optimizations and help turn data into action. Tools like Google Data Studio (now known as Looker Studio) make it easier to visualize Google Ads reporting and spot opportunities to improve.
We made a monthly display ad and paid search reporting template to make the process easy. Let’s walk through it.
Our PPC Report Template Runs on Looker Studio
Our free PPC reporting template is built in Looker Studio. It’s easy to set up with an existing Google account. If you haven’t tried it yet, do. We think you’ll love it. With the Supermetrics connector, Google Ads connector, and more, you can present far more than just Google Analytics data. It’s the go-to pay-per-click reporting tool used by our paid media team.
Download the Free PPC Reporting Template
To make the most of this report walk-through, start by downloading our free template:
Then follow these steps:
- Sign into Looker Studio.
- Open our template in Looker Studio, and make a copy by clicking the folders icon in the top right corner.
- When prompted, connect your main Google Analytics view and Google Ads account as the data sources.
After you’ve completed that, the blank boxes will turn into your paid media report with your data!
You may need to tweak some Advanced Segments and filters for individual charts. Just click on each chart and check the “Data” tab to be sure. Then feel free to expand your report as needed.
Here’s what’s inside …
Breaking Down the PPC Report Template
Section 1: Set the Details
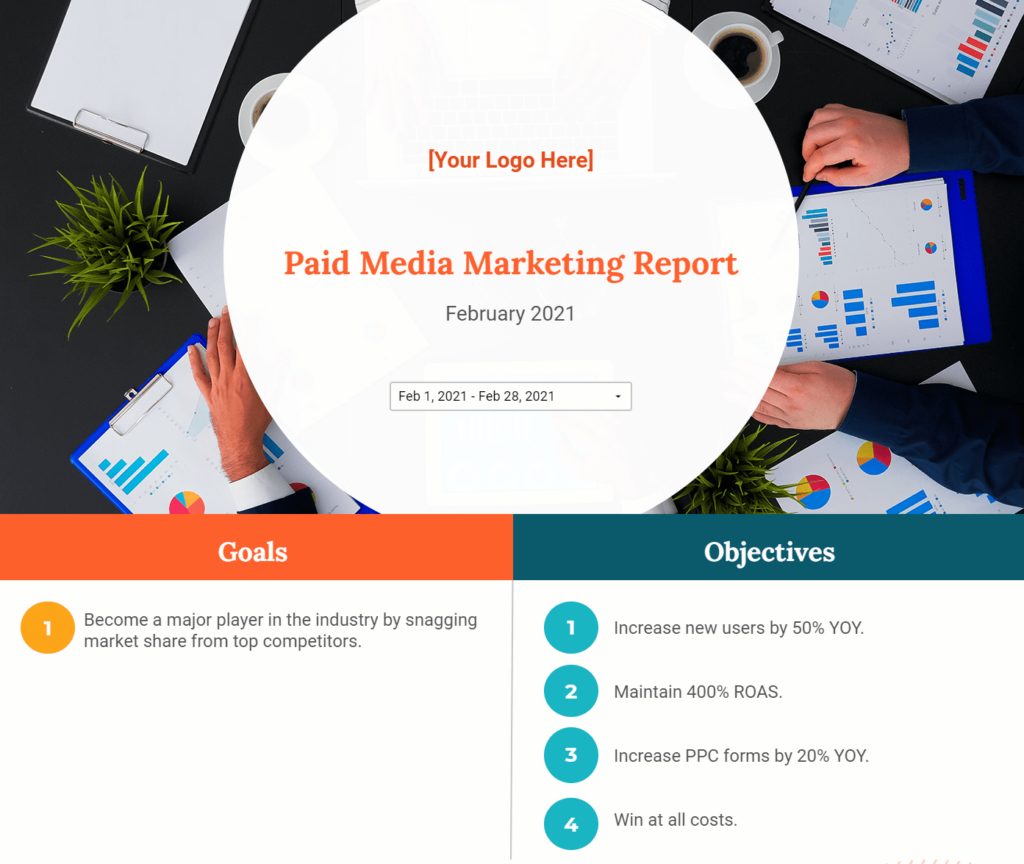
At the top of the report, add your logo, and select the desired date range.
As you can see in the date range, this is currently a PPC monthly report template. Feel free to look at a larger, smaller or different date range.
The built-in comparison date ranges in our template are set to “year-over-year” (e.g., February 2021 vs. February 2020). If you prefer to see “period-over-period” comparisons instead (e.g., February 2021 vs. January 2021), just adjust each chart’s date settings in the Data tab.
Next, fill in your goals and objectives.
Goals are broad, while objectives are measurable steps toward achieving your goals. We recommend starting your PPC report with this information so that, during presentations, you can explain your strategy in the context of objectives.
Section 2
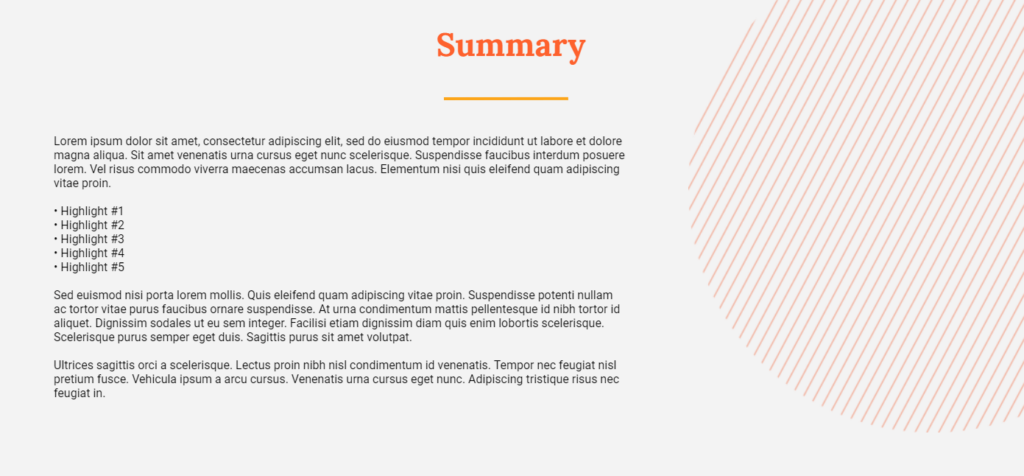
Complete the summary section of your report.
Use this section however you wish! Just make sure the terminology you use is appropriate for the audience you’re speaking to. You can use more technical terms with your internal paid team but remember to make your language accessible to send paid media reporting to a wider audience.
Section 3: Personalize the Channel Breakdown Table
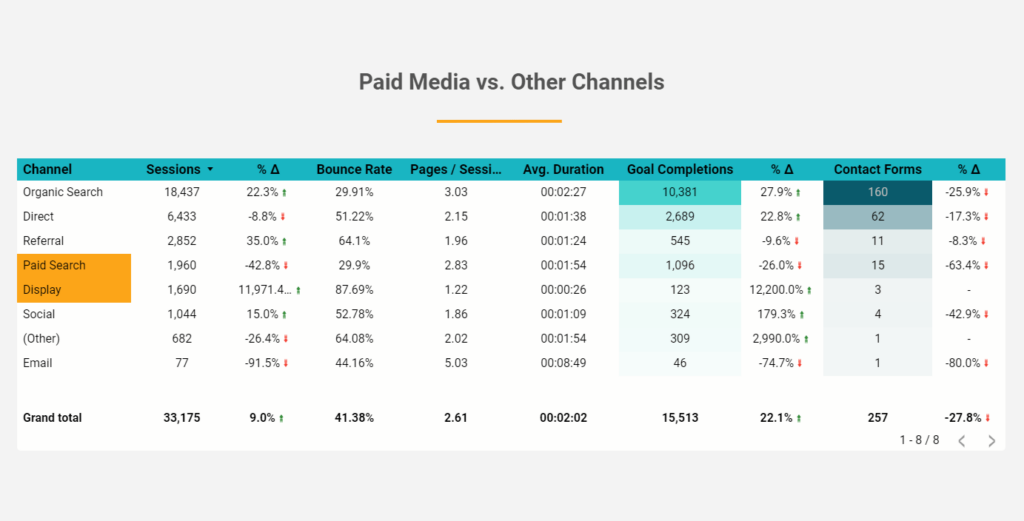
Personalize the channel breakdown table.
Here we show a mix of traffic metrics, engagement metrics and goal metrics by channel. This chart provides clues about the quality of users you are attracting with paid media (PPC) compared to other channels. Our paid media team uses data like this to optimize campaigns for our clients, and to align PPC with organic strategy.
Click into the table, and replace the “Goal Completions” and “Contact Forms” metrics in the Data settings so they are tied to your specific goal or event data from Google Analytics. (They will be configured for Oneupweb at first!)
Section 4: Check Out Channel-Specific Performance
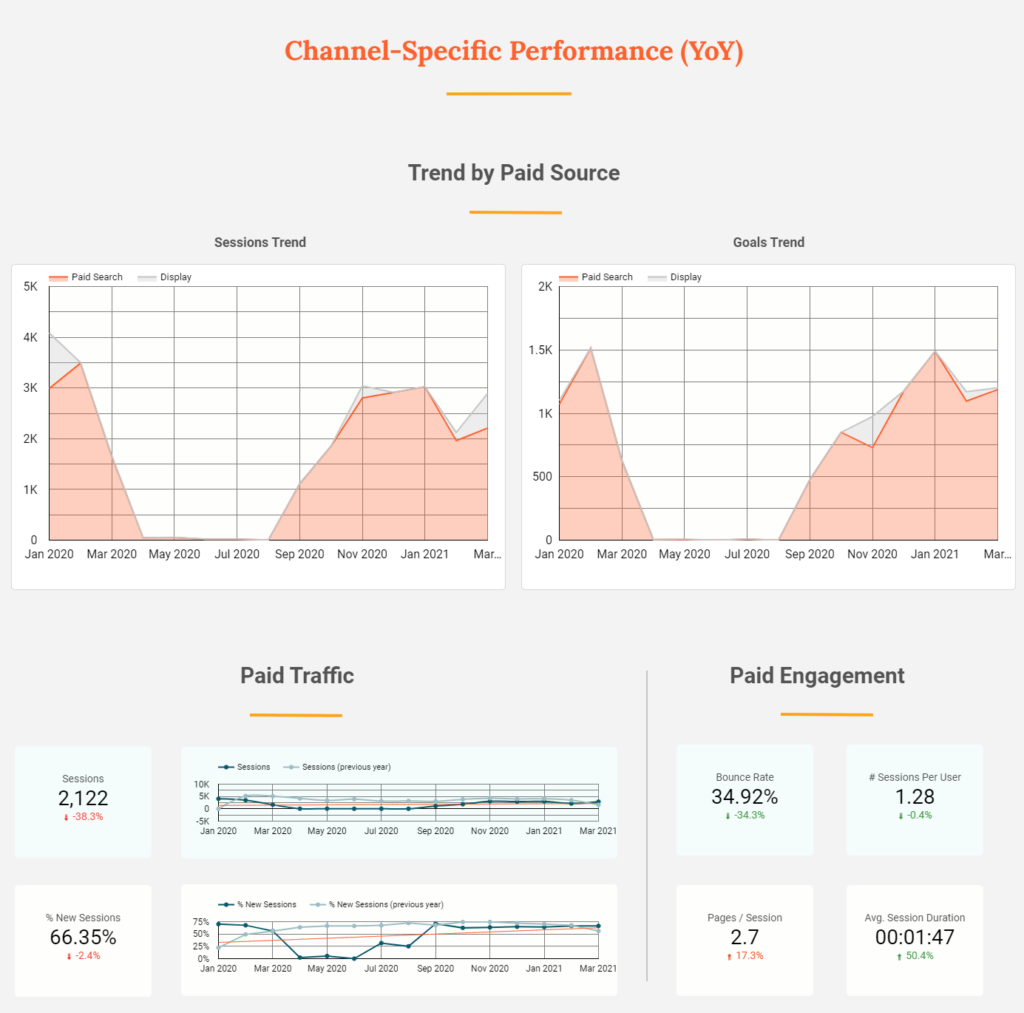
This section begins with graphs that break down paid media traffic by source. Because market interest is constantly in flux, it’s nice to look at a trendline for an entire year (or more) to get a complete picture of trends and seasonality.
If you’ve set up custom sources for some of your campaigns (e.g., programmatic), make sure you use a custom Advanced Segment so they show up on the graphs.
Next, there’s a simple breakdown of paid traffic and engagement from the month. The symbol “%▲” represents the percent change (in this case, it’s year-over-year) for the metrics in each scorecard.
Section 5: Confirm Your Goal Data
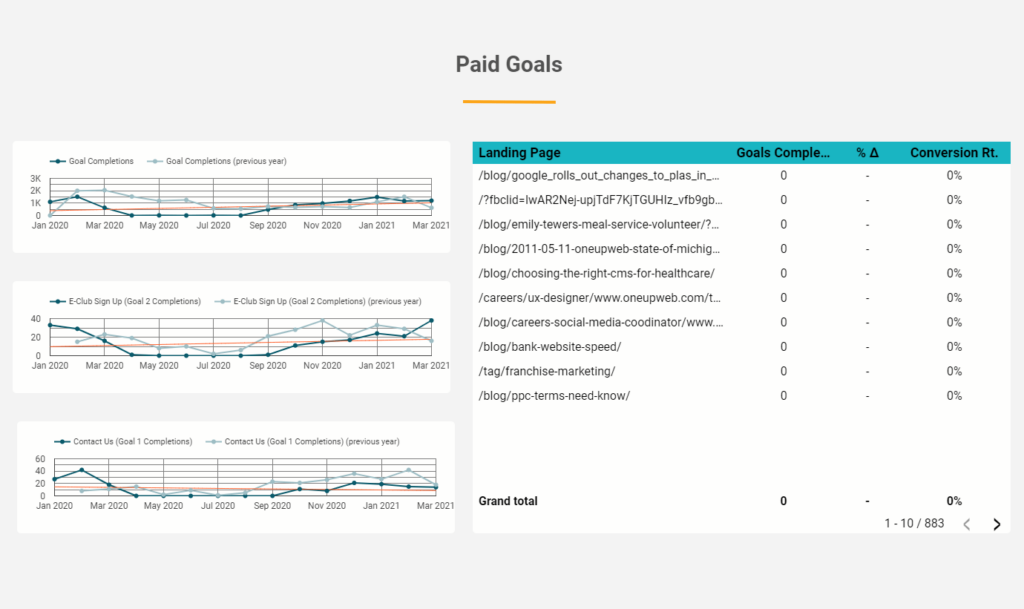
The line graphs show goal completions from all paid media channels over time. The table breaks down goals by landing page for the month (or whatever date range you set as default).
This section will require you to customize! It’s currently set up to measure Oneupweb’s goals, not yours. Configure each chart in the “Metrics” area of the Data tab. You shouldn’t need to adjust anything else.
Section 6: Double Check the Data Sources
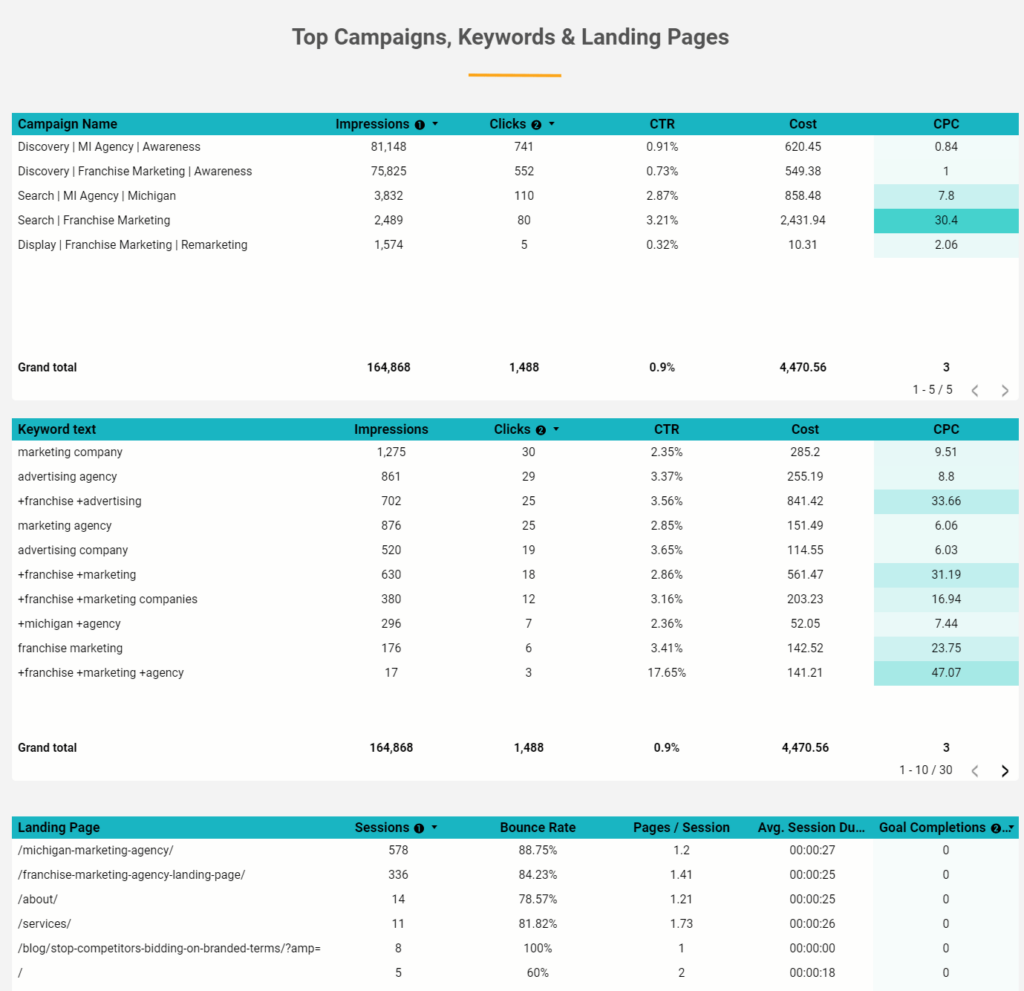
The tables beginning with “Campaign name” and “Keyword text” should be tied to Google Ads as your data source, not Google Analytics. Make sure this is the case! If you have it wrong, simply remove the current data source and add the correct one.
The third chart, which begins with “Landing Page,” should be associated with your Google Analytics data source.
If you’re wondering what other KPIs you may want to add to this section, check out our resource about determining KPIs by channel.
Section 7: Look at Geography and Demographic Data
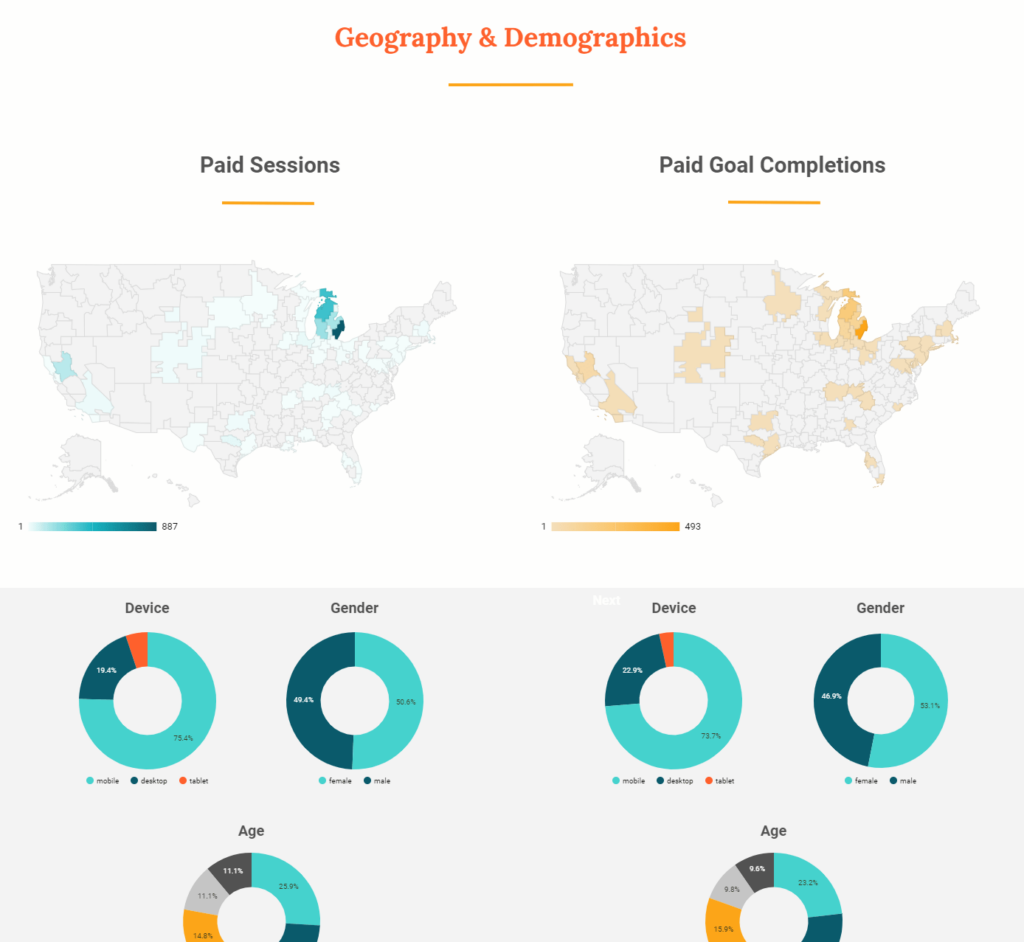
If you’re running national or multi-state PPC campaigns, these maps will show you where you’re getting the most interest – and if those people are converting. For example, if you’re getting ample sessions but no conversions in a specific region, you may consider redistributing some of your ad spend elsewhere.
As in previous sections of this template, be sure to update the “Metric” settings in the goal-related charts so you’re measuring your own business’s goals.
Section 8: Showcase Recent and Future Work
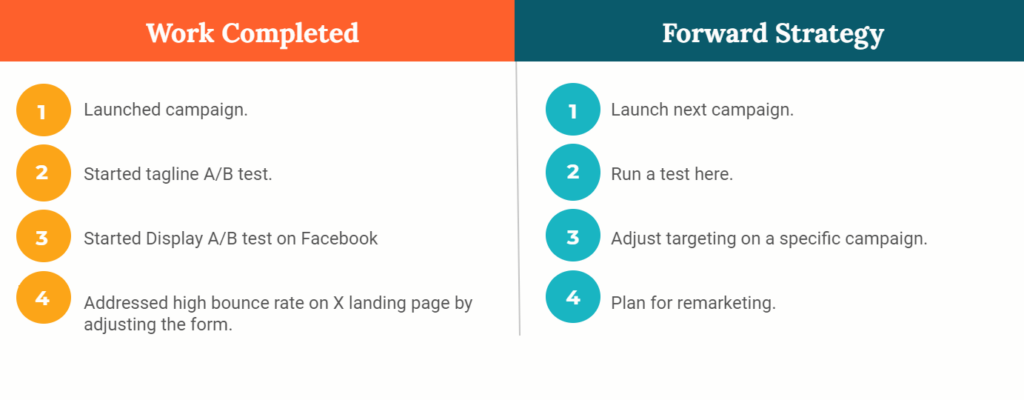
Lastly, this part of the PPC report template gives you a place to list work you completed recently and work you plan to do next. If you’re presenting the report to someone else, use this section to discuss how each action item is related to the performance you just looked at.
Translate Data to Action, Even If You’re Too Busy
Reporting helps you refine your paid media campaigns and get the best return on ad spend (ROAS). But filling out an ad performance report template is time-consuming and easier said than done! Oneupweb has a fun, knowledgeable team of paid media and creative experts to make your PPC strategy more powerful. Reach out or call (231) 922-9977 to share your challenges with us.